Manage your research projects with clarity
From spreadsheet chaos to visual clarity. AllocBoard helps research teams manage staff allocations, project budgets, and expenses in one place.
Has anyone updated the Horizon EU allocations? Reporting deadline is Friday and I still see last quarter's numbers.
budget_RP2.xlsx was edited by 3 people. Which version to keep?
Spreadsheets weren't built for research grants
Allocation data spread across dozens of spreadsheets. When the PI asks for a quick update, it takes hours to piece together an answer.
A postdoc on four projects, but working out their total commitment means opening multiple files and cross-referencing by hand.
Every reporting deadline, the same fire drill. Pulling numbers from scattered files and hoping nothing was missed.

Complete visibility, one platform
Every allocation in one place. When the PI asks for an update, you have the answer in seconds.
A postdoc on four projects? See their total commitment instantly. Overloads are flagged automatically before they become a problem.
Reporting deadline? Audit-ready reports in a click. No fire drills, no scrambling.
Catch overcommitments before the auditor does
AllocBoard highlights the moment any researcher exceeds 100% allocation across projects. Visual warnings with clear person-month totals — so you can fix it now, not explain it later.
See who has capacity before you commit
Staff availability projections show you exactly who can take on new work. Smart allocation suggestions balance workloads across your portfolio — apply them one by one or all at once.
Risk Assessment
Audit-ready reports in seconds, not days
Generate structured risk assessments with one click. Every insight grounded in your actual allocation data — ready for EPSRC, EU Horizon, or UKRI review.
Plan your project before the grant lands
Model staffing, budgets, and timelines for upcoming proposals. Run feasibility analysis to check if your existing team can deliver — then convert the plan to a live project in one click when the award comes through.
Everything you need, one platform
From high-level dashboards to granular timelines — manage projects, track staff allocations and expenses, and oversee multiple research groups all in one place.

Real-time Stats
Active projects, staff count, and utilization rates at a glance
Overload Alerts
Instant visibility into over and under-allocated staff members
Staff Availability
See who has capacity for upcoming projects
Use AllocBoard on any device
Whether you're at your desk or on the go, the full app adapts to your screen. Every feature available on desktop, tablet, and mobile.

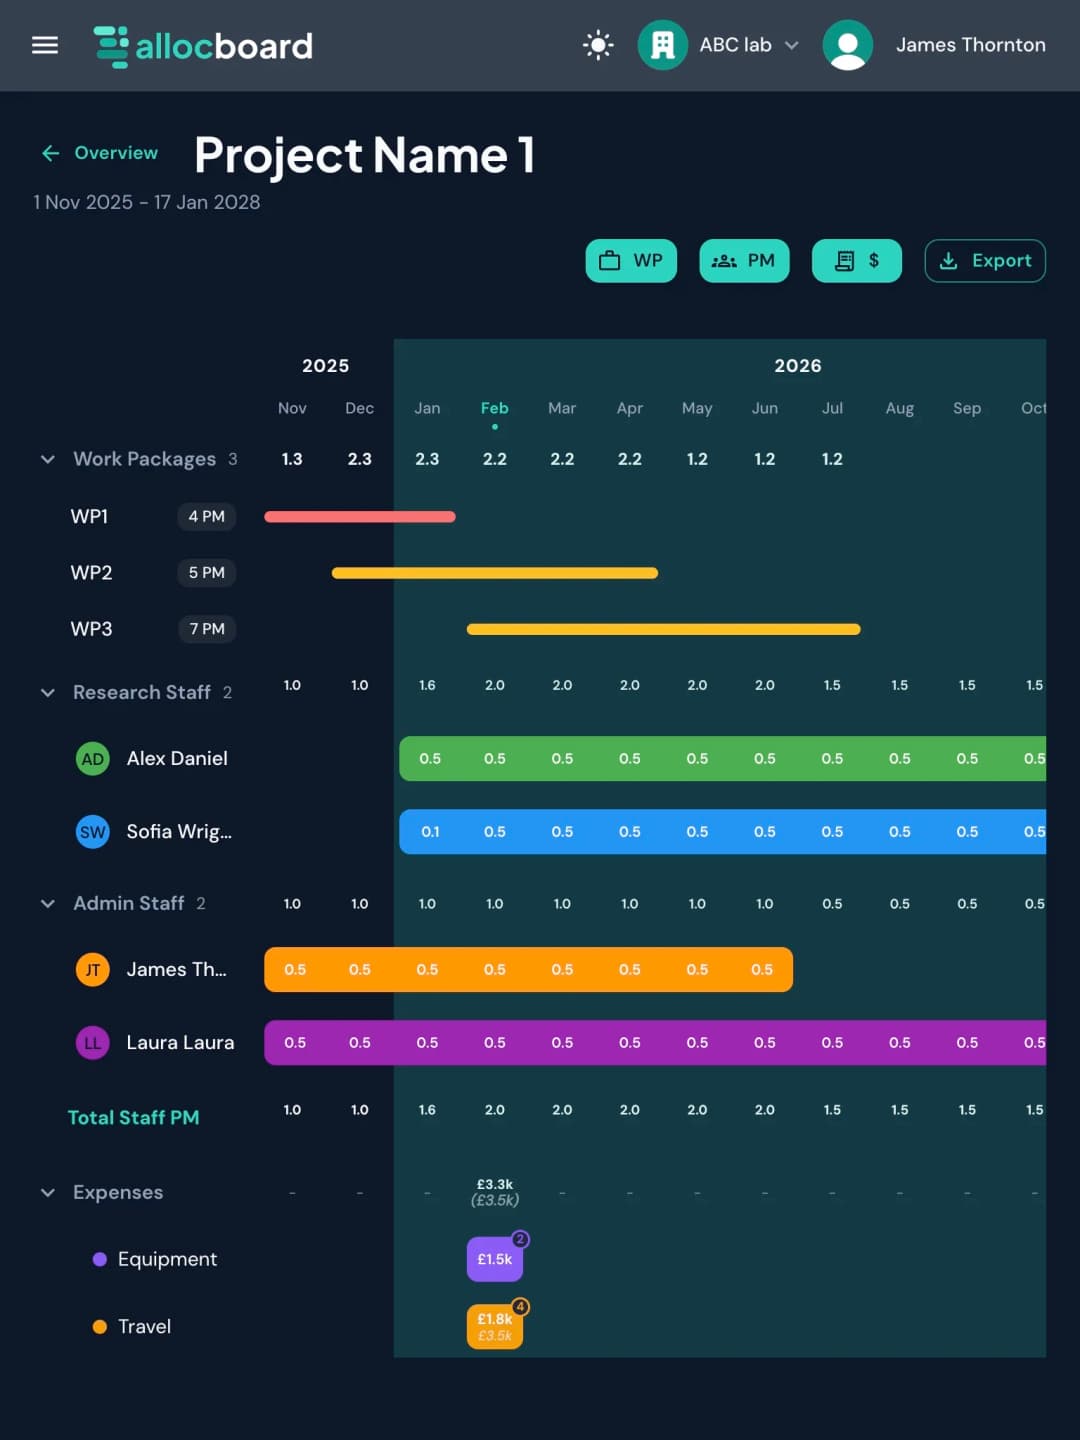
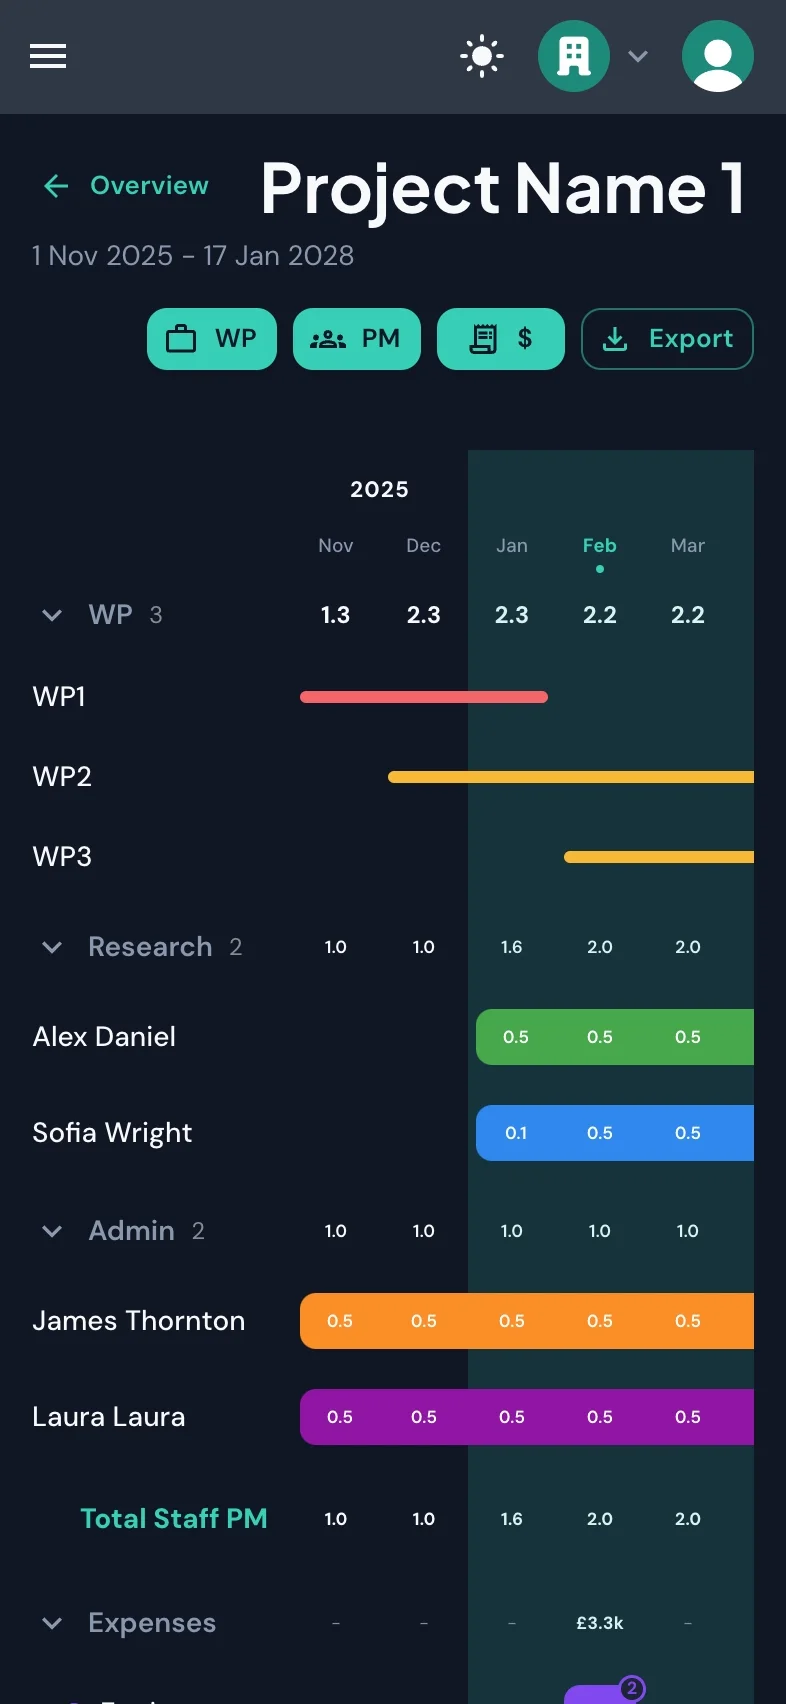
Responsive Design
Optimized layouts for every screen size
Full Functionality
All features available on mobile and tablet
Fast & Native Feel
Touch-optimized with smooth performance
Ready to simplify your research project management?
Purpose-built for research teams. Switch from spreadsheet chaos to complete project visibility. Join the pilot programme — no credit card required.